The most important element in photography is light and therefore understanding how to capture the full range of light that is within your scene. In this tutorial, you will learn how to make sure, that your photos are always exposed correctly during all conditions.
I don’t know if you already experienced this situation, but what bothers me the most about my photography is sitting in front of Lightroom or Photoshop and thinking that I should have taken one additional shot of the scene because the clouds are too bright or something went darker than expected where some of the details are missing. This extra image would have taken me nearly no further effort right at the location, but fixing this issue afterward in post-processing is sometimes impossible or just painful, especially when I love the photo itself.
Your learning could be to take as many photos as possible with different exposures to make sure that every time you take a photo you use bracketing with 3-5 or even more stops. Although this might be a safe way, it also has some disadvantages you might think of:
- you need more time during the shot because you always have to take multiple images (and we all know that time can be a critical factor in getting a great photo when the light is just perfect for just a couple of minutes)
- you need more space on your card / hard drive
- you need more time to go through all the photos you took
- post-processing needs additional steps to merge the photos (for example luminosity masks)
Despite bracketing is a great technique you need to know when to use it and how many different exposures you need to capture all you need to get the best results. Quite often multiple exposures aren’t needed, especially with new camera sensors that are getting better in capturing a wider range of light.
Fortunately, there is a great tool that helps you to make sure that your photo contains really everything you wanted to capture: the histogram.
Understanding the histogram
The histogram might appear quite complex or technical, but it’s really easy to understand and one of the best ways to make sure that your exposure is perfect. The left part of the histogram shows the black areas, followed to the right by the shadows, the mid-tones, the highlights, and the whites in the very right area. The higher the graph, the more of those tones are in your image, which means that the histogram is just running over every pixel in your photo and counting how often a value occurs.
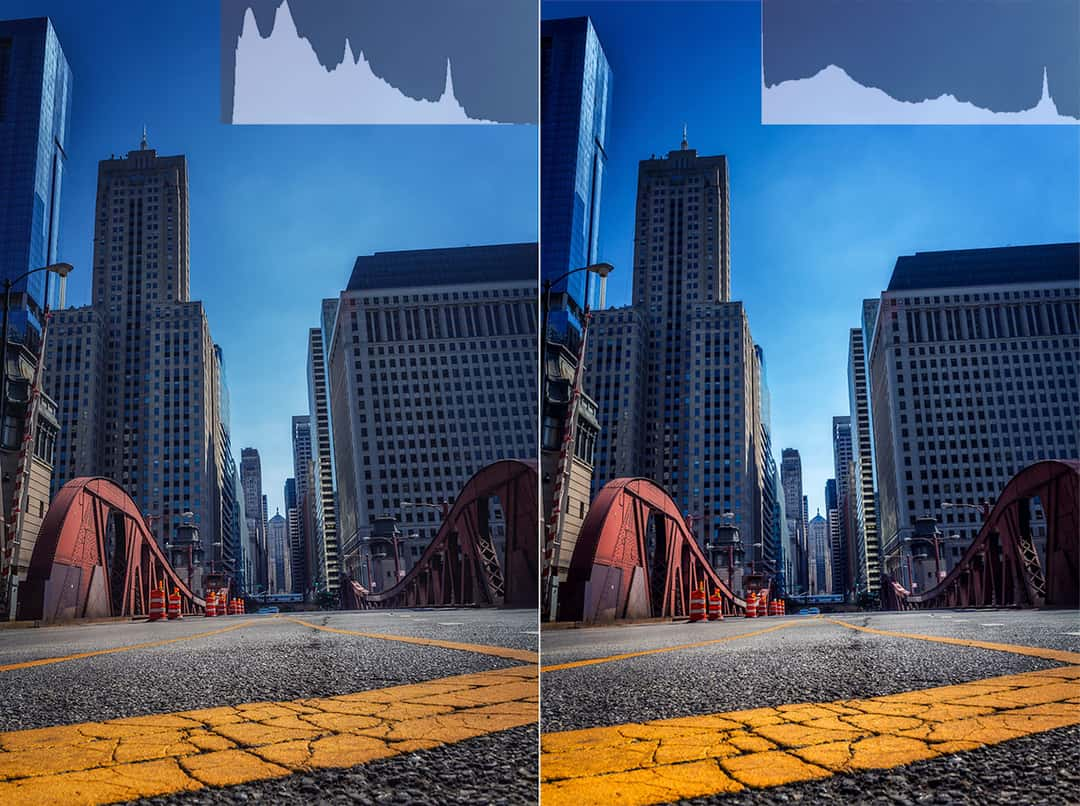
A photo on the streets of Chicago with the original histogram on the left side and a stretched one on the right side which adds more contrast to the image, because more of the available color and brightness range is used.
As you can see in the left photo from Chicago there are quite some dark tones (high graph at the left), but also a lot in between and a peak on the right side of the center of the histogram, which is probably the part of the bright sky. There are 2 important things that you can learn from this histogram:
- There are no parts at the very right or the very left of the histogram which means that we exposed this image perfectly since no pixels are pure white or black. If this happens you lose the information of some parts of the image, which means that something in the sky might be just white and is not recoverable by just dragging down the highlights slider in Lightroom.
- We could improve the contrast and the range of tones by stretching the histogram as we did on the second image because there are still a lot of parts at the sides of the histogram that are not used, which means that there is no pixel in the image that is nearly white. If you are using Adobe Photoshop you can correct this with the Levels-Tool (Ctrl + L) and press "Auto" or use the sliders to the whites/blacks. The same applies to Lightroom by using the whites-/blacks-sliders until the histogram just touches the borders to the sides.
Different types of histograms
To make the histogram even easier to understand we will look at a few different examples.
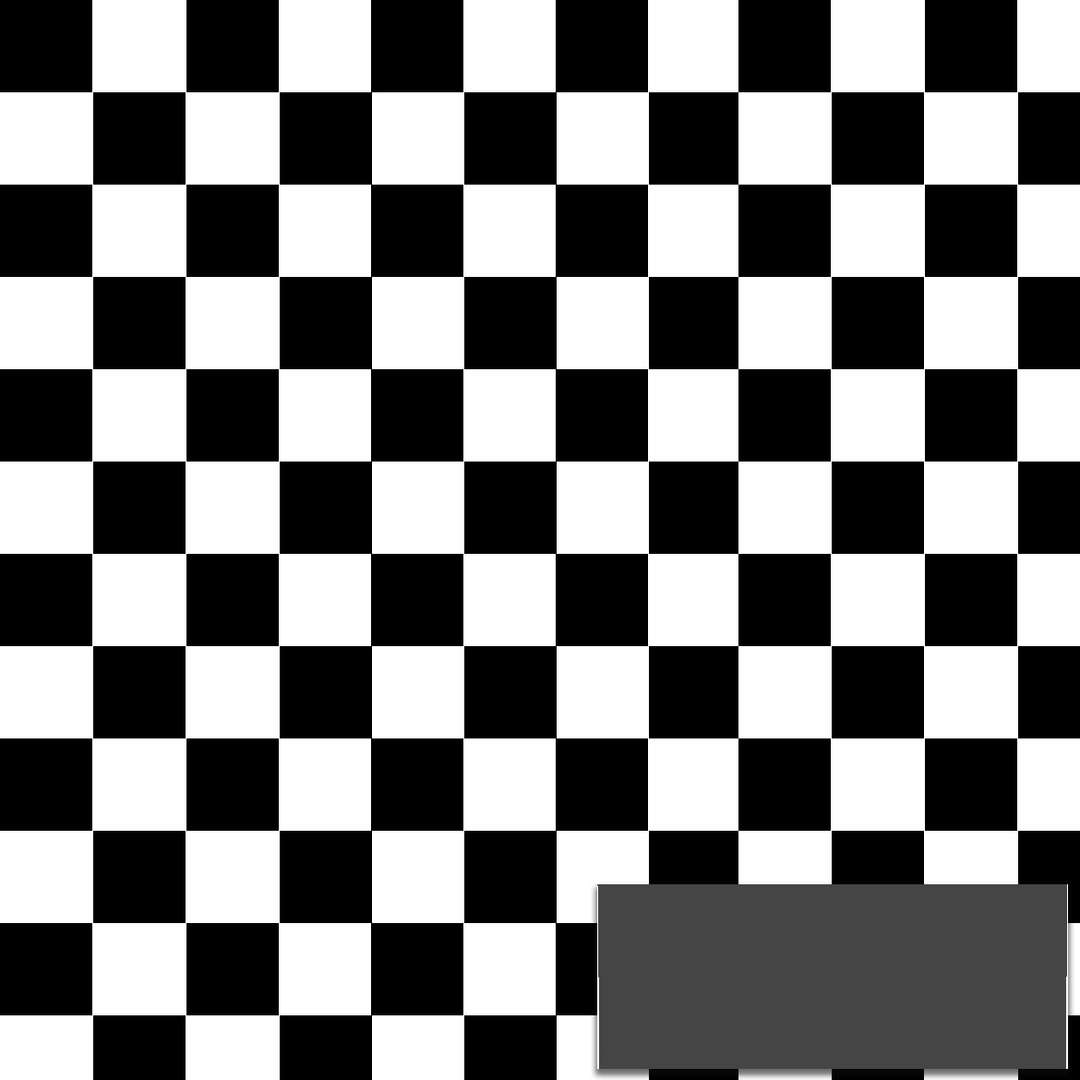
The histogram above is just showing 2 brightness levels: one at the left and one at the right corner because there are only blacks and whites in this image. As you can see the positions of the colors don’t matter to the histogram. It’s only about the amount of brightness levels that occur in your image.

A linear gradient however should show an equal amount of levels over the whole histogram, which seems to be not quite true for one you created in Photoshop. The reason behind this is the smoothing that Photoshop applies to let the gradient look more natural. This results in more darker and more brighter tones, letting the histogram look like a stretched U. Nonetheless there is no extremely high peak at the sides, which means that we don’t have any totally white or black pixels in our image.
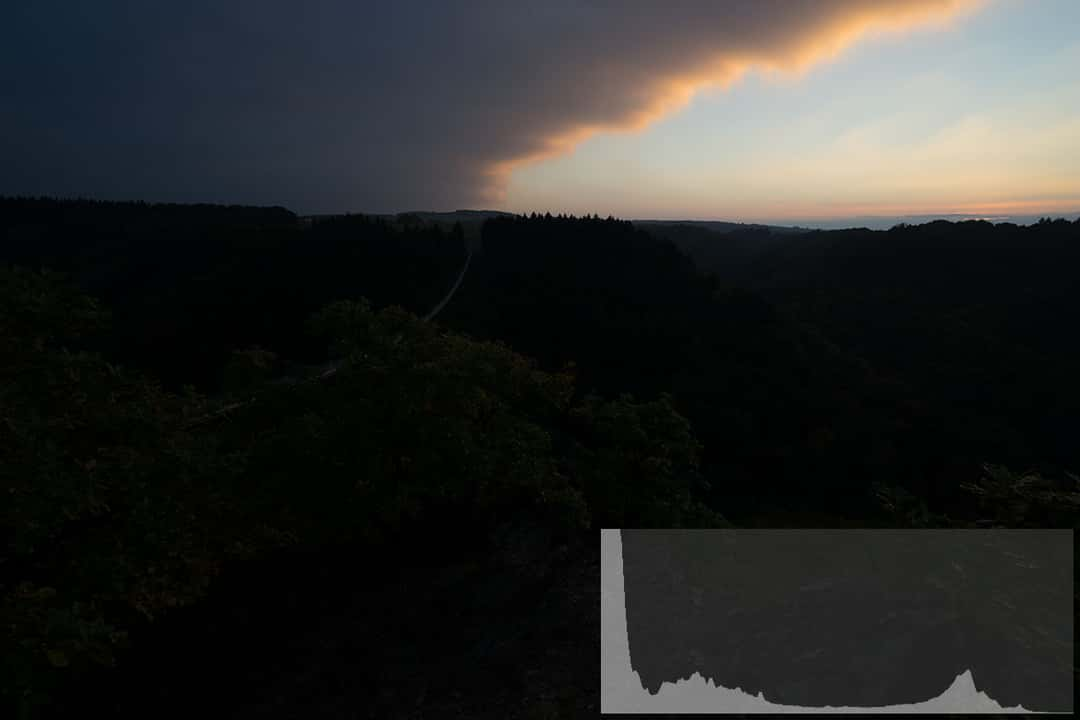
You should even check the histogram when doing bracketing because it gives you a very good indicator if the photos you took are enough for the whole spectrum of light you wanted to capture. This is the -2 photo, resulting in a very high graph at the left, which is totally fine since we are resolving this issue by taking 2 more shots. Important in this shot is to make sure, that we are not cropping the whites on the right side of the histogram.
![This is the "usual" shot you would have taken and it highly indicates that you need more than just one exposure and therefore bracketing. The blacks and the whites are both cropped, which means that we are losing details in both parts of the image. Because we are shooting RAW [hopefully you do! ;-)] we can still get back some of those details, but usually not without getting some noise in the darks. That’s a good way to make sure that we absolutely need bracketing for this shot to get the highest quality in our final results.](https://images.locationscout.net/2016/05/article-how-to-get-perfect-exposures-for-every-photo-you-take-pq3y.jpg?w=1080&q=60)
This is the "usual" shot you would have taken and it highly indicates that you need more than just one exposure and therefore bracketing. The blacks and the whites are both cropped, which means that we are losing details in both parts of the image. Because we are shooting RAW [hopefully you do! ;-)] we can still get back some of those details, but usually not without getting some noise in the darks. That’s a good way to make sure that we absolutely need bracketing for this shot to get the highest quality in our final results.
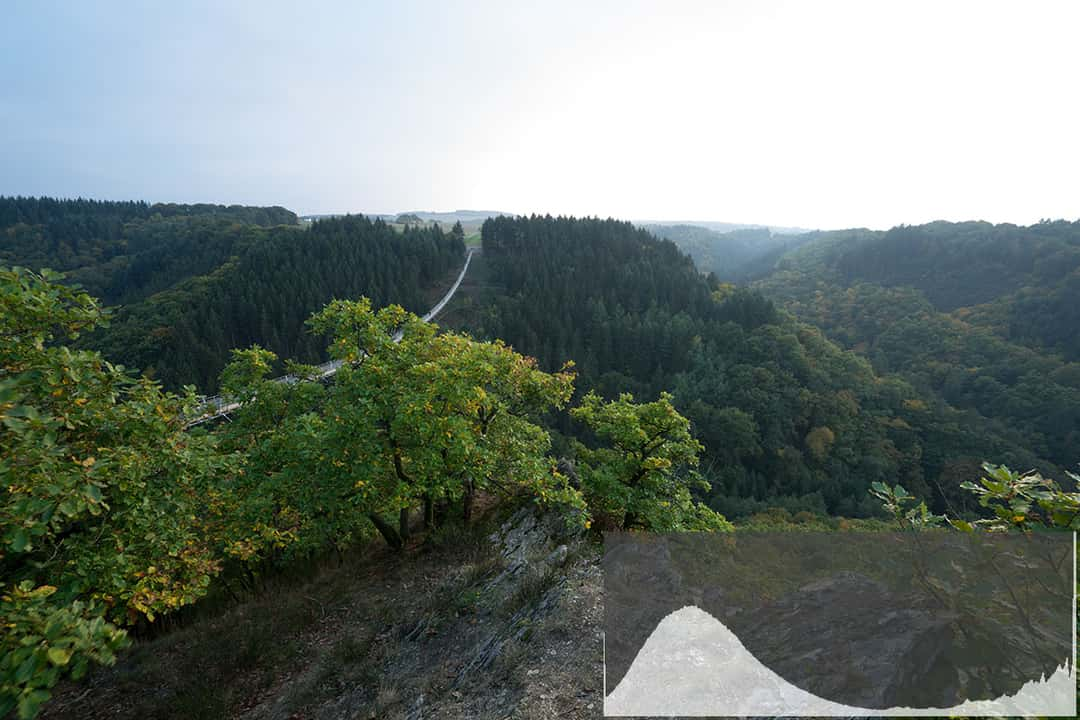
The last +2 exposure shows a very high graph at the right side, which in this case doesn’t matter since we already got that area in our -2 exposure. Important for this one is the left side and to make sure that we are not losing too many details here. As you can see I could have exposed this one even a little bit longer, but I don’t care as much for the dark areas as for the bright ones. I almost ever want some really black parts in my images, so this is fine to me and I still can back some of those parts in Lightroom. In general, you should always take more care of the highlights because camera sensors are much better at capturing the details in dark areas.
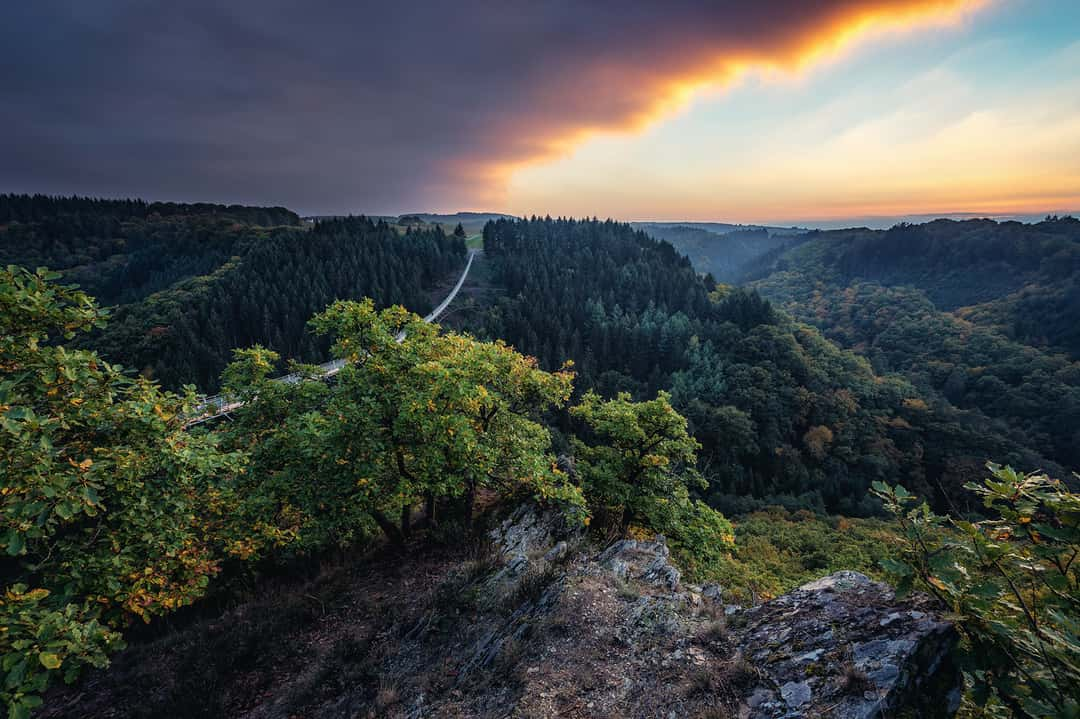
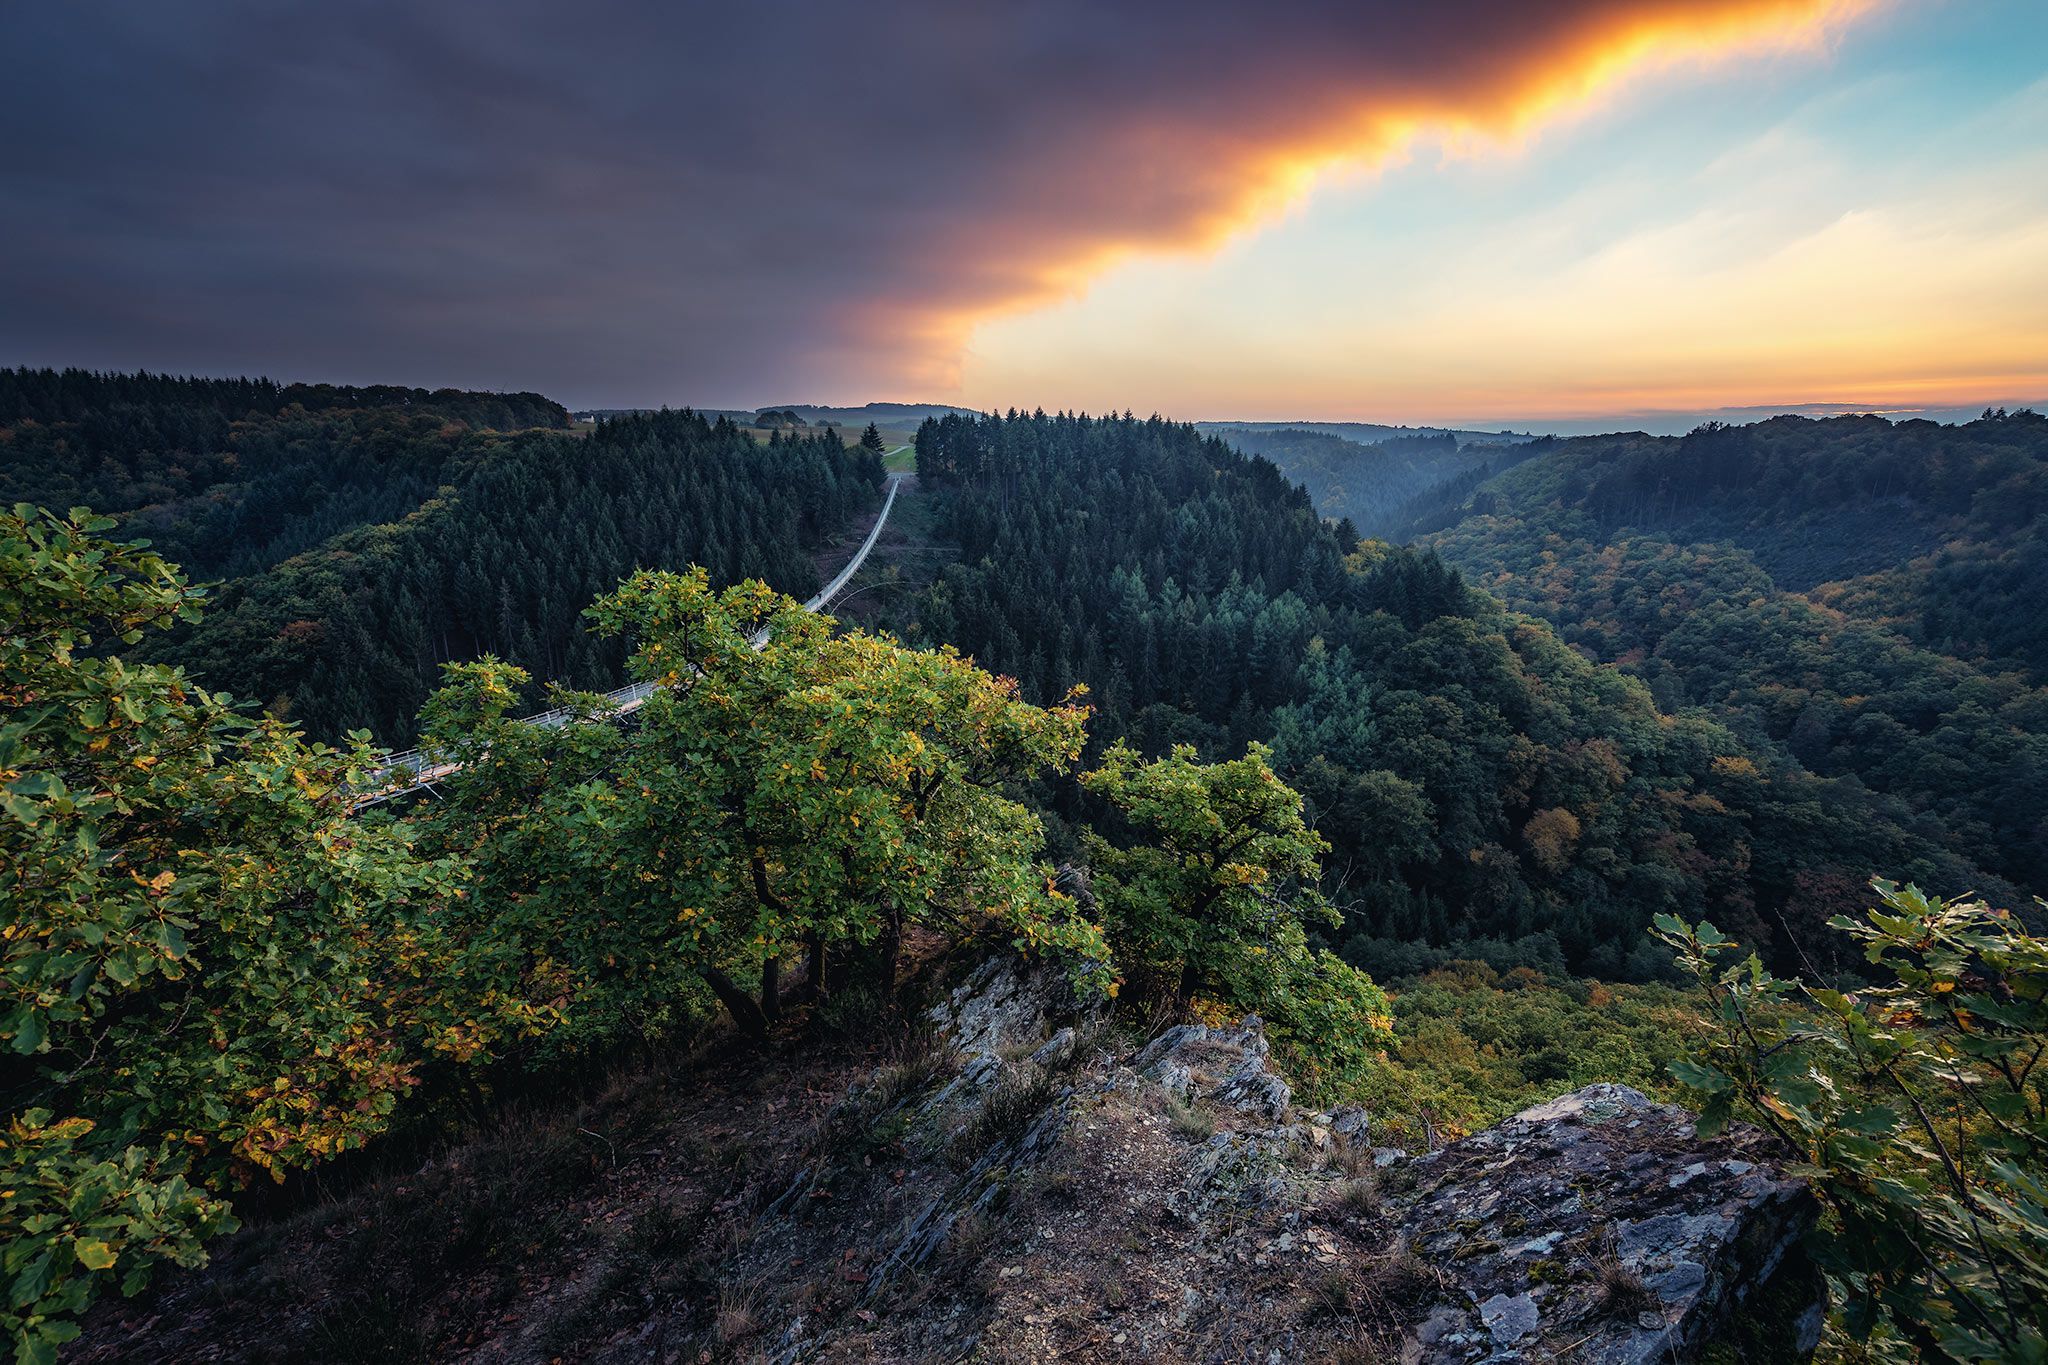
The final image of Germany's longest rope bridge near Geierlay, composed together with luminosity masks to get the best exposed parts of all of these 3 shots.
Conclusion
Before taking as many shots as possible during your photography sessions you might think about using the histogram of your camera to make sure that you get all the details you need for the best results. Even if you want a really dark mood in a scene it’s never a bad choice to capture everything and to decide afterward in post-processing to darken the scene and use a lot of black and dark tones.
Use the histogram to decide if you really need bracketing and if you do so, make sure that you captured all the light you need for the final image. If you can get all the details just within one shot you can use the exposure compensation to "move the histogram" if you are for example shooting with aperture priority mode. In manual mode, you can just change the exposure time. A longer exposure moves the histogram to the right, because more light gets on your sensor, resulting in a brighter image.
If you are shooting from a tripod you can use live view to see the histogram before taking the shot, making it even easier to adjust the settings to your scene. Some of the newer mirrorless cameras like the Sony A7 are even able to show you those details directly in the viewfinder.


Comments (6)